The following is a trajectory analysis study of the EUR/USD. It will be tracked weekly for projected pivot points with potential entry and an exit scenarios. Key data points will be provided on a daily basis. Weekly trajectory provided a few hours before London opens for the week. Daily updates to occur at end of day (approximately 17:00 EST- Seattle Time) which is the operations center.
Seattle Time:
WEEK 6 – BEGINNING JANUARY 8, 2018
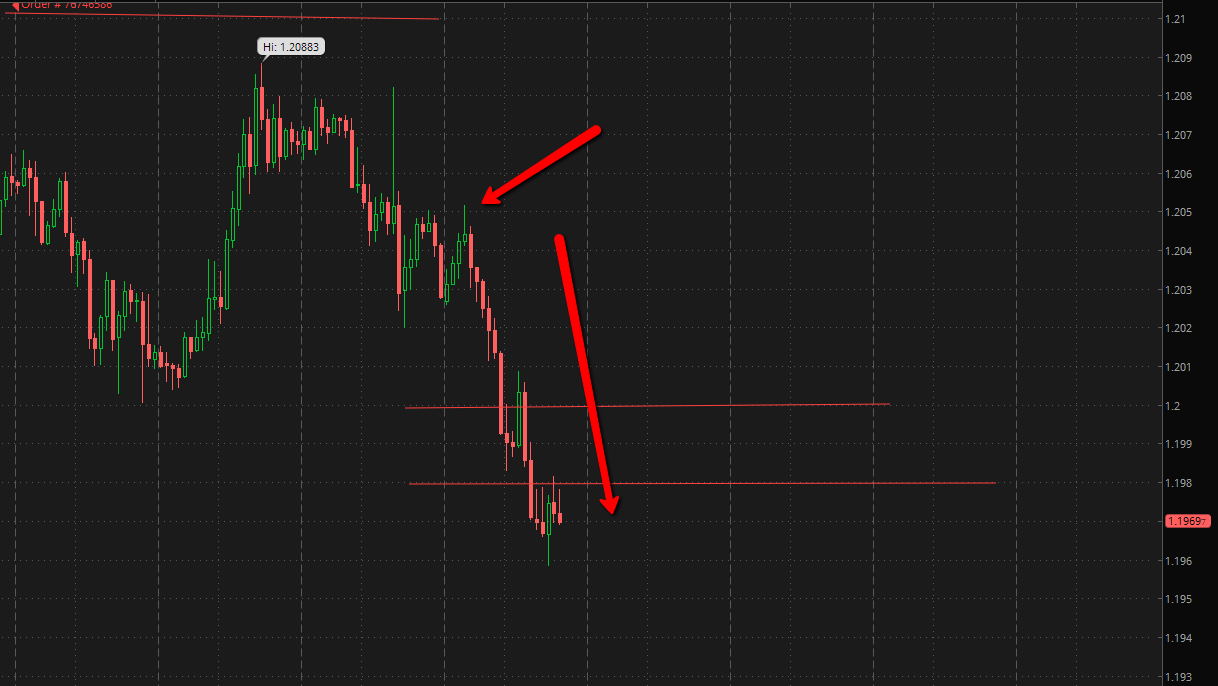
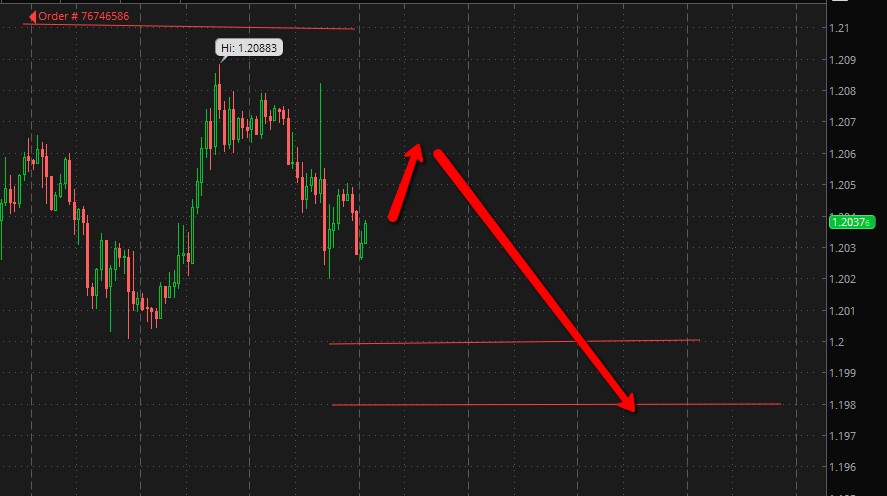
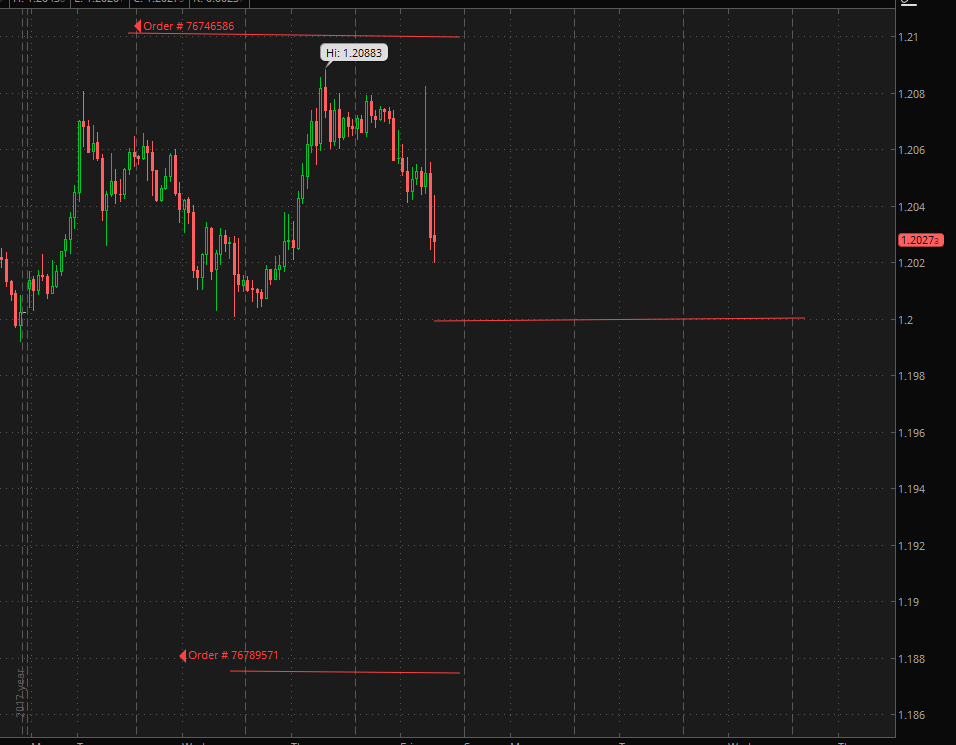
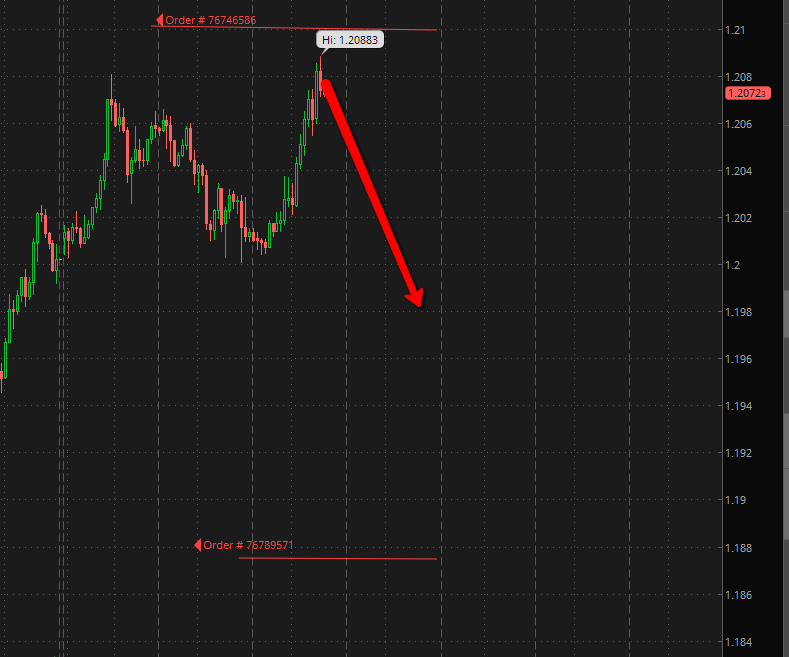
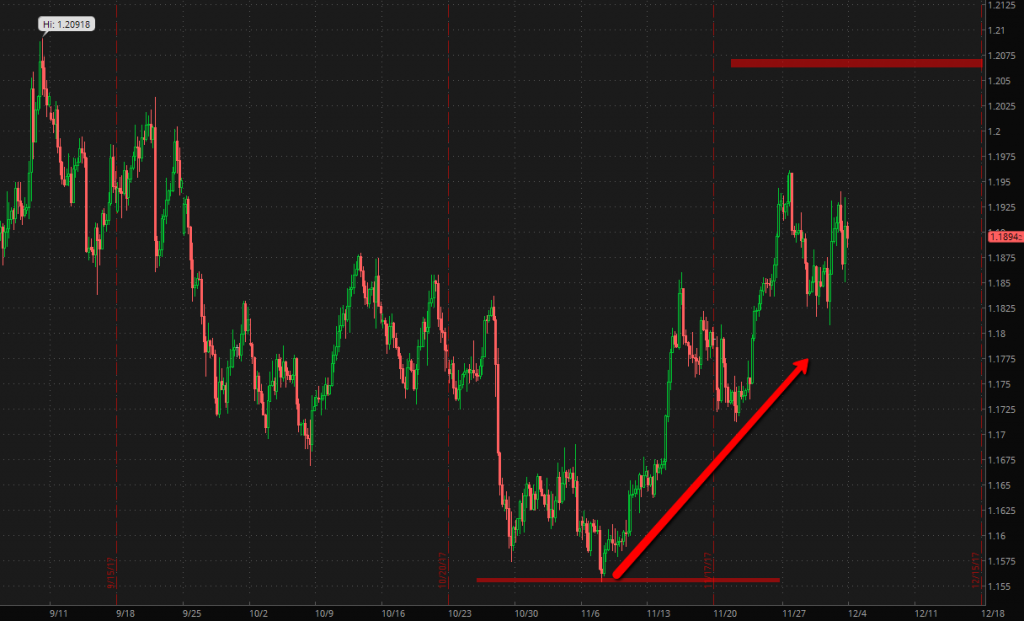
DATA-SET TARGETED WAS INTENDED ORDER POSITIONS OF 1.21000 SELL AND 1.1980 BUY. THIS WAS THE INITIAL WEEKLY TARGET ALONG WITH OVER-ALL TRENDLINE. DAILY UPDATES WILL BE TESTING THE BAND SCALPING SYSTEM
Jan. 11, 2018
4:40pm PST
ANALYSIS/ACTION STEPS
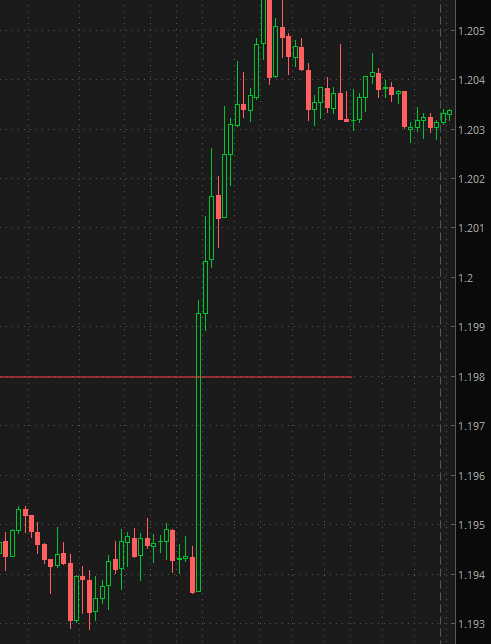
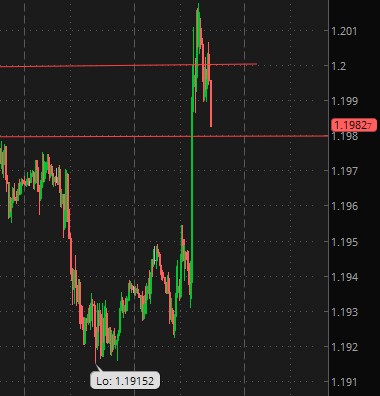
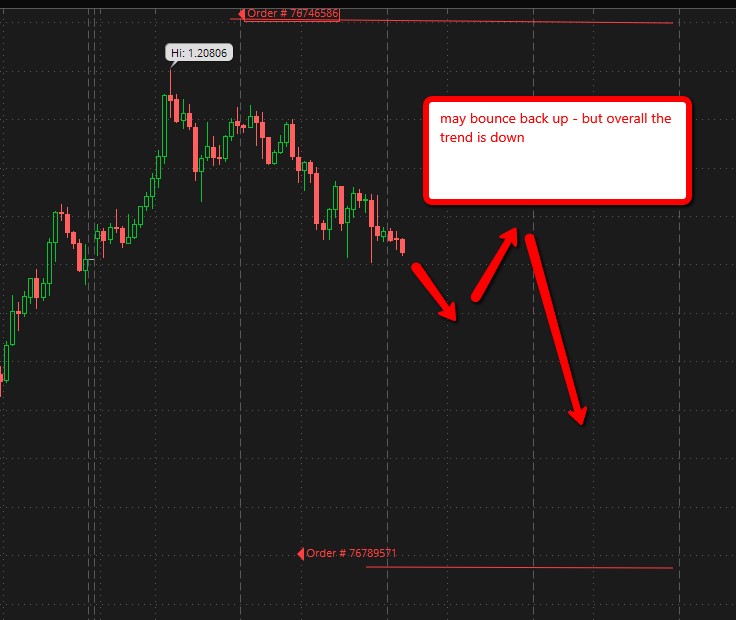
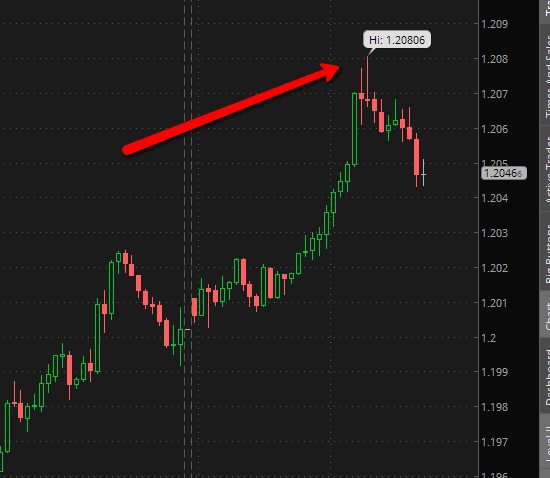
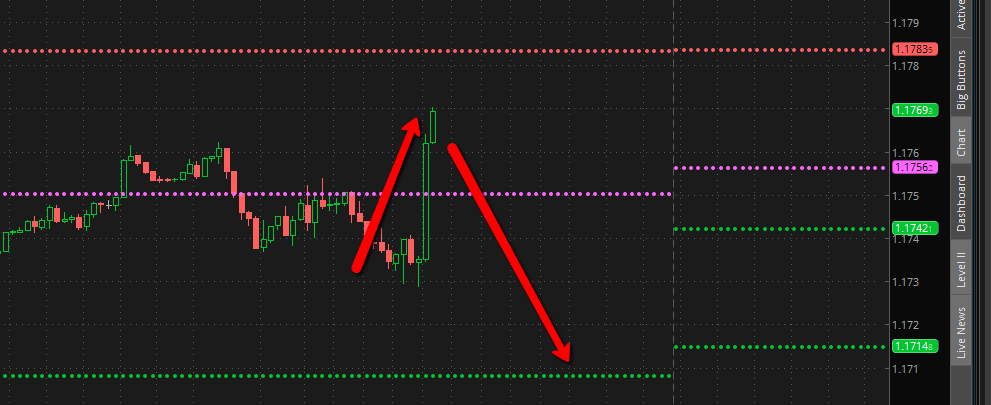
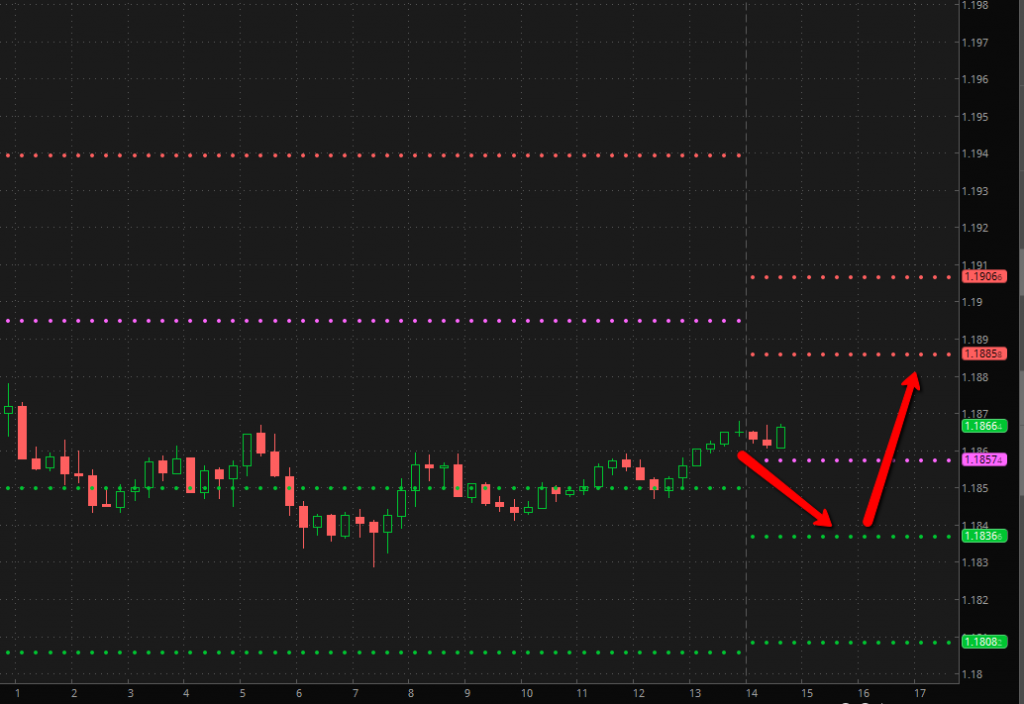
DAILY UPDATE: There appears to be a continuation of the spike up after a brief retrace. We see it continuing an upward trend which could go to 1.2300. We are overall optimistic in the long move at this point.
Jan. 11, 2018
6:40am PST
ANALYSIS/ACTION STEPS
UPDATE : The spike up was much steeper that the data revealed, but if correct should retrace in the next few hours and then continue the upward trend.
actual move
Jan. 10, 2018
4:07pm PST
ANALYSIS/ACTION STEPS
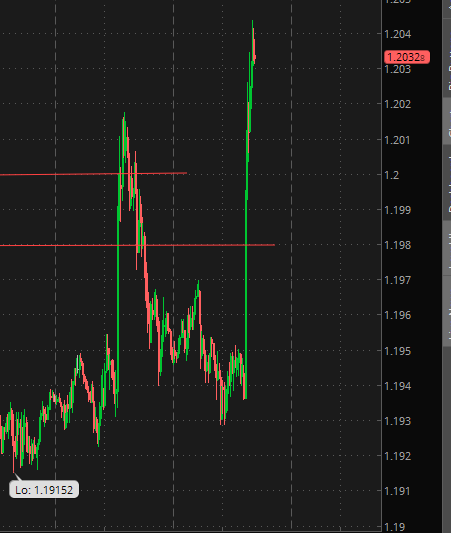
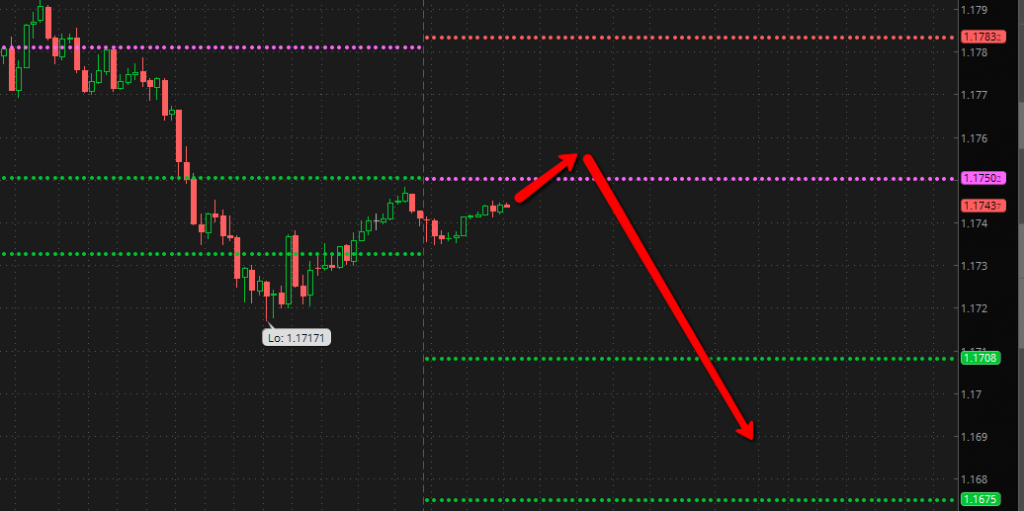
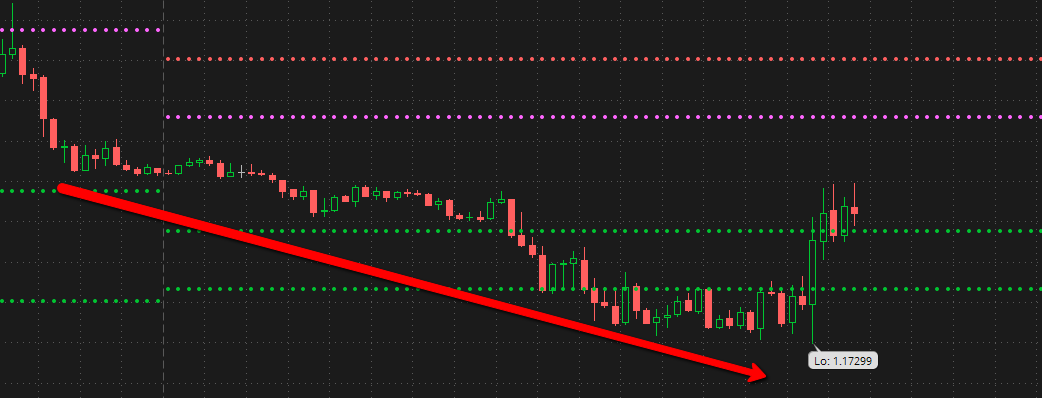
DAILY UPDATE : THE data appears similar to yesterday. It does go up but may not be a much of a spike before retracing. Its ranging in the 1.1960 area before beginning a move down.
actual move
Jan. 10, 2018
6:32am PST
ANALYSIS/ACTION STEPS
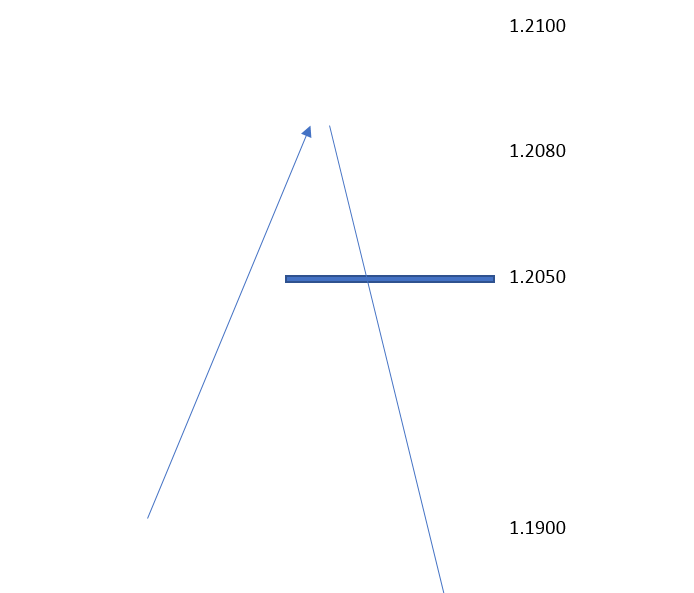
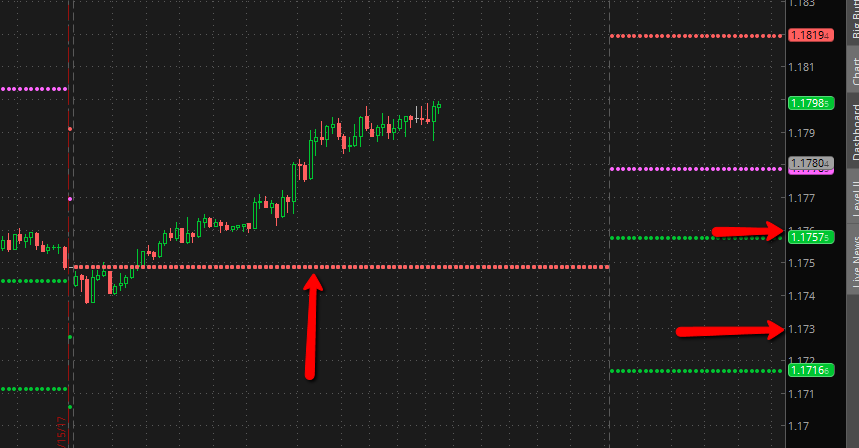
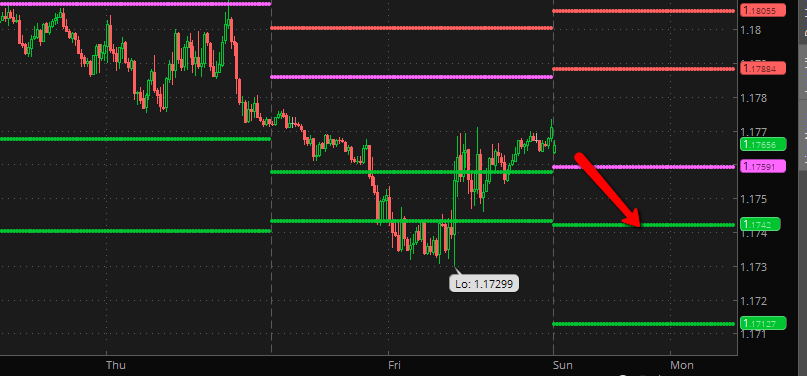
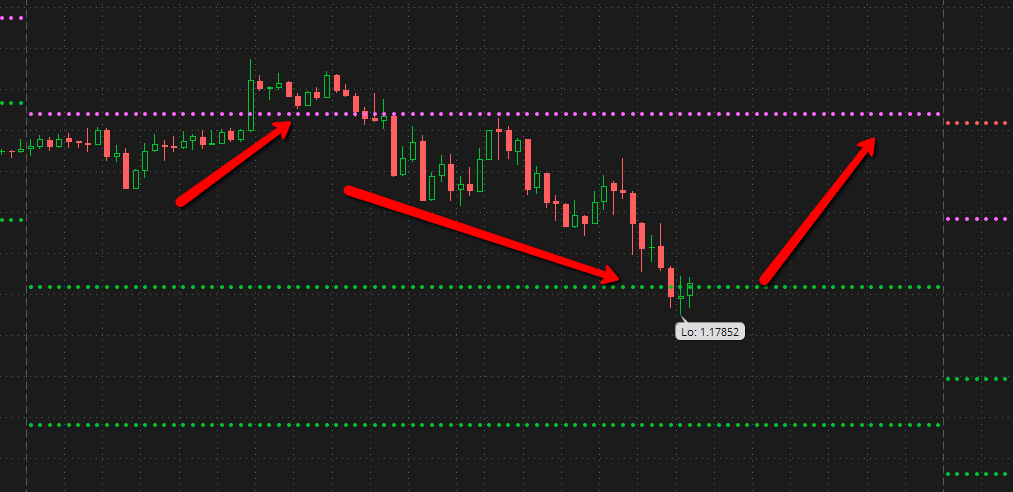
MORNING REVIEW: THE data on on open SELL position #76729328 @ 1.2075 was correct, but the analysis wrong. See the sketch below… and the lines crossed v the chart this morning. This can be frustrating as it was not corroborated though its clearly there. This is where its more art than science to make the correct interpretation call… If the data is correct it should be a top and then continue downward, but it will need to be verfied. One of the weaknesses is the ability to grasp amplitude – but we should have captured this correct to scale.
actual move
TRV data
analysis of move
Jan. 09, 2018
3:45 PST
ANALYSIS/ACTION STEPS
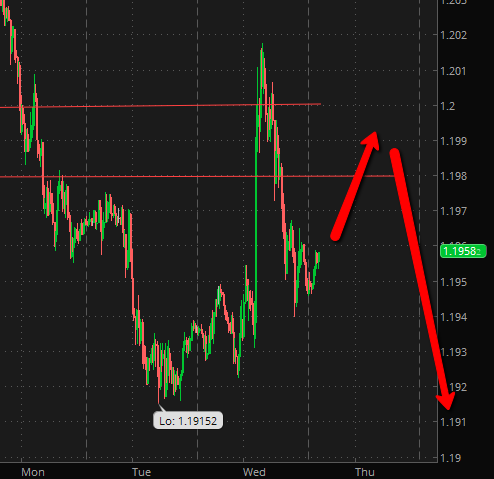
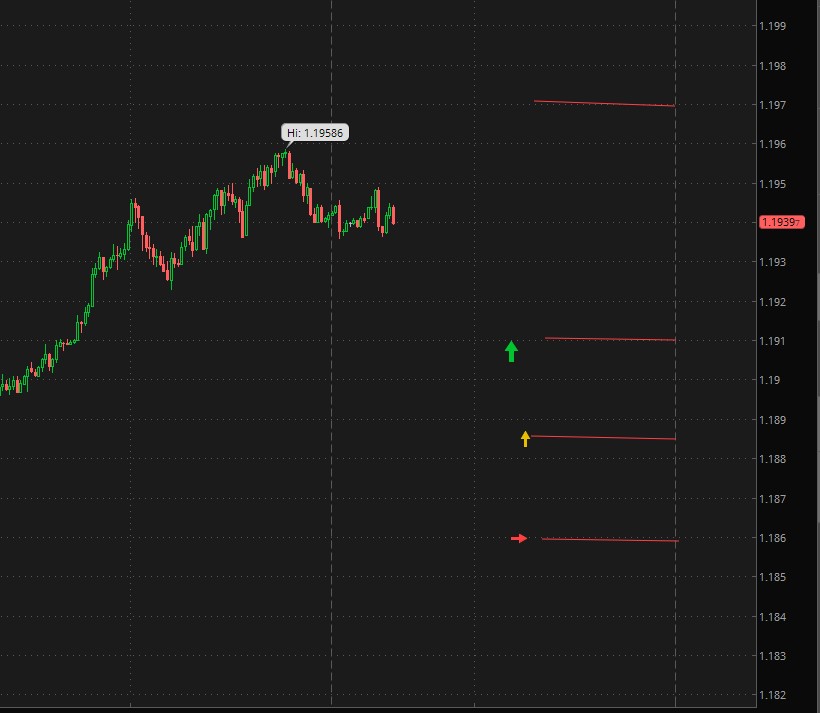
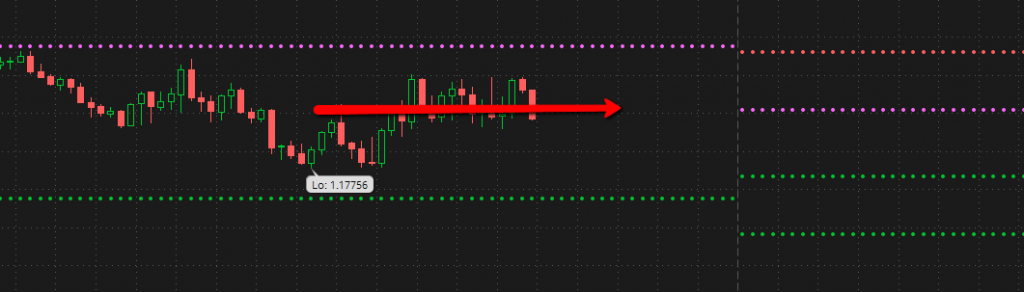
DAILY UPDATE: Viewed open SELL position #76729328 @ 1.2075 and though it moves up from its current level at present time – it does not trigger a stop. The new limit buy order placed 1.1880 does not appear to trigger in the next 24 hours. The market seems to see-saw up and down over this period without establishing a solid direction. The overall trajectory appears to be down and there was data that the 1.1880 would be reached
Jan. 09, 2018
5:56am PST
Jan. 08, 2018
4:26pm PST
ANALYSIS/ACTION STEPS
UPDATE: The move is unfolding exactly as forecast and after some retrace should continue ibelow 1.1900 per the data. We will revise in the daily update.
DAILY UPDATE: After a retrace up the down move continues but may range sideways. There is pressure on it downward, which may be due to UISD strength. The bands are being tested in 10 pip increments… sketch below.
Jan. 08, 2018
10:00am PST
ANALYSIS/ACTION STEPS
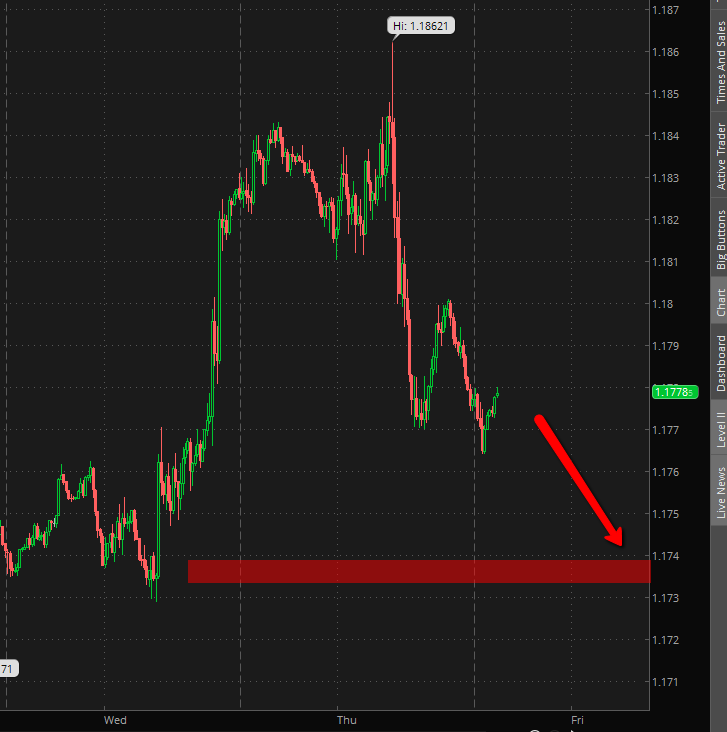
UPDATE: Site was down overnight, so this update was delayed. This is a shot of the chart as of an hour ago, which reveals the trajectory unfolded exactly as the data suggested This will be appended later today to verify the stsong downward trend in yesterday’s sessions.
Jan. 07, 2018
3:27PM PST
ANALYSIS/ACTION STEPS
PRELIMINARY TREND AND ORDER DATA:
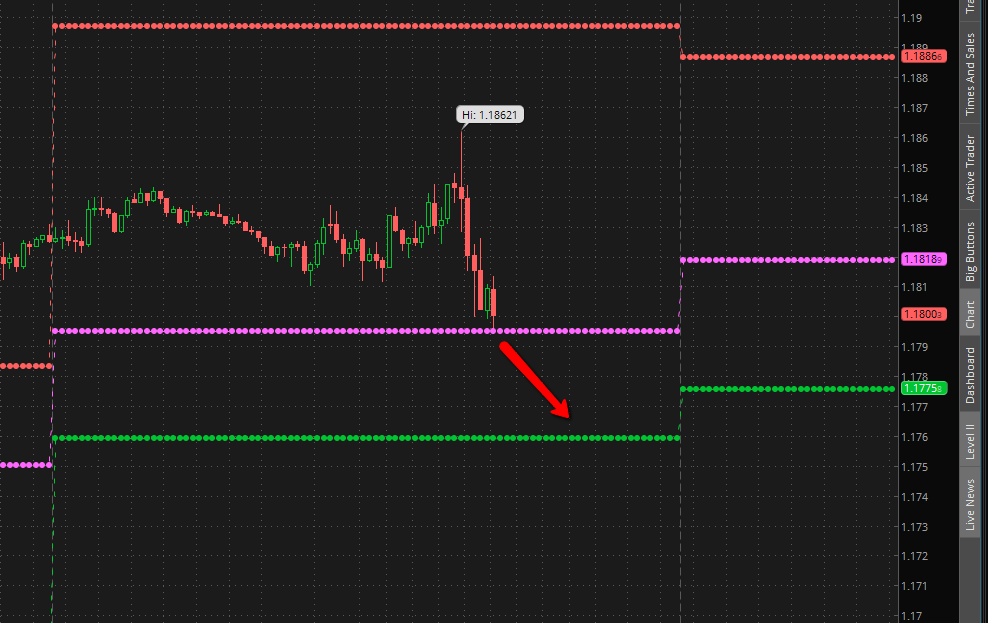
Data suggested an initial up move and then something triggers a significant downward move. The data revealed that the target traders BUY position at 1.1980 would be triggered in the next 48 hours, and possibly go way below it. We will update this move.
WEEK 5 – BEGINNING JANUARY 1, 2018
DATA AND TRADING TO RESUME BEFORE LONDON OPEN JANUARY 2, 2018. DATA-SET WITH NEW REVISED PROTOCOL ON TRADER’S OPEN POSITION AND BRACKETED ORDER SET TO BE POSTED AT OR AROUND MARKET OPEN AFTER THE HOLIDAY.
NOTE TO CLIENT: WE ARE DOING SESSION WORK OVER THE WEEKEND ON A PIECE OF ANOMALOUS DATA BASED ON A TARGET CREATING THE MOST PROFITABLE TRADING METHOD/SYSTEM USING TRV. THE IDEA LOOKS LIKE “BANDS’ WHERE THE DIRECTION IS KNOWN OVER A SHORT TIME FRAME (4 HOURS) AND THE TARGET TRADER ENTERS MANY SMALL ‘TAKE PROFIT’ TRADES IN EFFECT SCALPING 5-10 PIPS EACH TRADE AND REPEATING THE PROCESS 8-15 TIMES PER TRADING SESSION, EFFECTIVELY COLLECTING 50+ PIPS PER DAY IN PROFIT. MORE ON THIS IDEA NEXT WEEK…
Jan. 05, 2018
8:07AM PST
ANALYSIS/ACTION STEPS
MORNING UPDATE:
The priceline moved as the data suggested (and spiked up on the jobs report) and though came close to 1.200 it did not execute below it… and it likely not to before market close today. Will will update a revised trading plan using an improved strategy next week.
Jan. 04, 2018
4:04PM PST
ANALYSIS/ACTION STEPS
DAILY UPDATE:
We see it popping up to order #586 again in this session but not triggering or crossing it.
The data suggests that the limit order priced @ 1.19900 does not trigger though it will eventually – entry extends past the 24 period of the daily update
The data suggests order # 759 continues and is eventually profitable (not stopped out) – though will not take profit until later than the 24 period viewed/
Jan. 04, 2018
7:45AM PST
ANALYSIS/ACTION STEPS
UPDATE: The bounce up went higher than we anticipated but we are still looking for the price to follow it down into the 1.19 range per the data
Jan. 03, 2018
4:12PM PST
ANALYSIS/ACTION STEPS
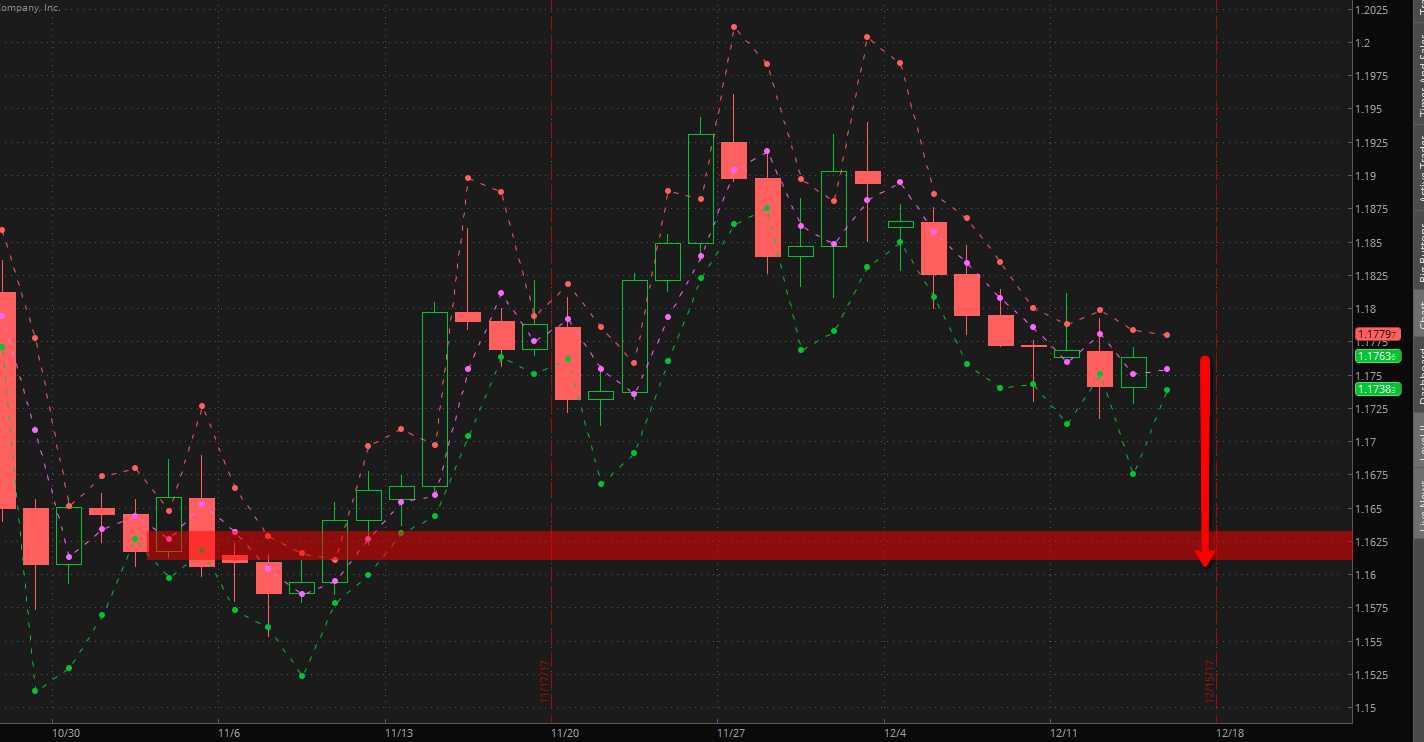
DAILY UPDATE: We worked the target and the 3 target orders along with an overall trend-line analysis. We got the overall trajectory was short over the next 24 hours. Order # 586 does not trigger. Order #571 may not trigger in the next few hours, but the data said this price area will be reached. The idea of “repeat this trade” was in the data-set (order 571). Order #563 was incomplete and a question asked of the Target client who did not respond and the viewers proceeded as if this was an open position. This TP appears to be eventually reached though not in the short-term period of 24 hours. Market may be ranging in the 1.119 area for the rest of the week thought is data to support it gong lower.
Jan. 03, 2018
6:28aM PST
ANALYSIS/ACTION STEPS
UPDATE: The price movement did as the TRV suggested and moved down and did NOT trigger any of the limit orders placed above the priceline. The idea of the target trader going “short” manually and ignoring these higher prices was accurate for the 24 hour trajectory. We will repeat the protocol today for the next 24 hours, and use the Traders open positions as the key trigger as this is much stronger as a signal for our team viewers to grab onto. Note: the chart snapshot below which was taken at present time and shows the order tickets not triggered. NOTE Overall this protocol can be made successful to determine trendline and directional outcomes using live orders
Jan. 02, 2018
2:41PM PST
ANALYSIS/ACTION STEPS
DAILY UPDATE: We worked this earlier today and focused the TRV update on 4 “possible” order tickets created by the Target Trader to zero in on the potential of a short position and where to place it as well to further test a more granular entry capability for this protocol. The overall data was this week may express “a new catalyst” driving a “Sell On The News” situation for EUR. We have a new short bias after the peak event is realized and we reported pn in this morning’s update a few hours ago and as noted below.
The limit orders placed were looked at, though as we discovered last week and also today, the signal line seems weak and these may be as reliaable as we wish them to be. There was specific data about the Trader using “bands” which would be more accurate as an indicator. After looking more closely these may be just pivot lines used by the trader to create the trading zone.
As for the specific order tickets generated by the Trader – the session data seems to suggests that ticket # 586 may not be triggered though the price goes higher than present. The trader seems to not wait for this and enters a sell order, prior to this triggering. Limit orders placed at 1.207 and 1.2085 do not appear to matter or trigger which may mean the Trader removes these, or they expire. We only looked at a period of 24 hours – though time-frames ARE NOT always reliable. This order ticket data is not strong – unlike the data of an existing open position which seems to have a rich and defined trajectory in the TRV data.
Jan. 02, 2018
6:51AM PST
Jan. 01, 2018
4:00PM PST
ANALYSIS/ACTION STEPS
UPDATE: One of the key pieces of data dealing with what the Trader needs to know, was the idea of “peak” and then its “short from here” which may be the recent spike and this is the key datum for the target trader.
PRELIMINARY WEEKLY DATA/ANALYSIS: Current long position (order # 712) opened at 1.2024 will continue upward momentum but will not trigger TP according to the data. It is expected to peak (non corroborated) around 1.2050 before moving downward..
Data suggests Trader “closes a position early.” It was uncertain which position even though the target cue was based on the long trade opened @ 1.2024.
There was data this week, of making a nice profit short by hitting the peak just right and riding it down.
When asked what the Target Trader needs to know to be a success – it returned data of using “bands” as a technical indicator on top of the TRV data. The client may know what this mean.
Data suggests Order #636 is triggered
Data suggests Order #360 is not triggered
WEEK 4 – BEGINNING DECEMBER 24, 2017
OVERVIEW: (project is resumed after pause for non-payment). Low volume and sideways movement over the first trading day of the week – December 25-26 2017
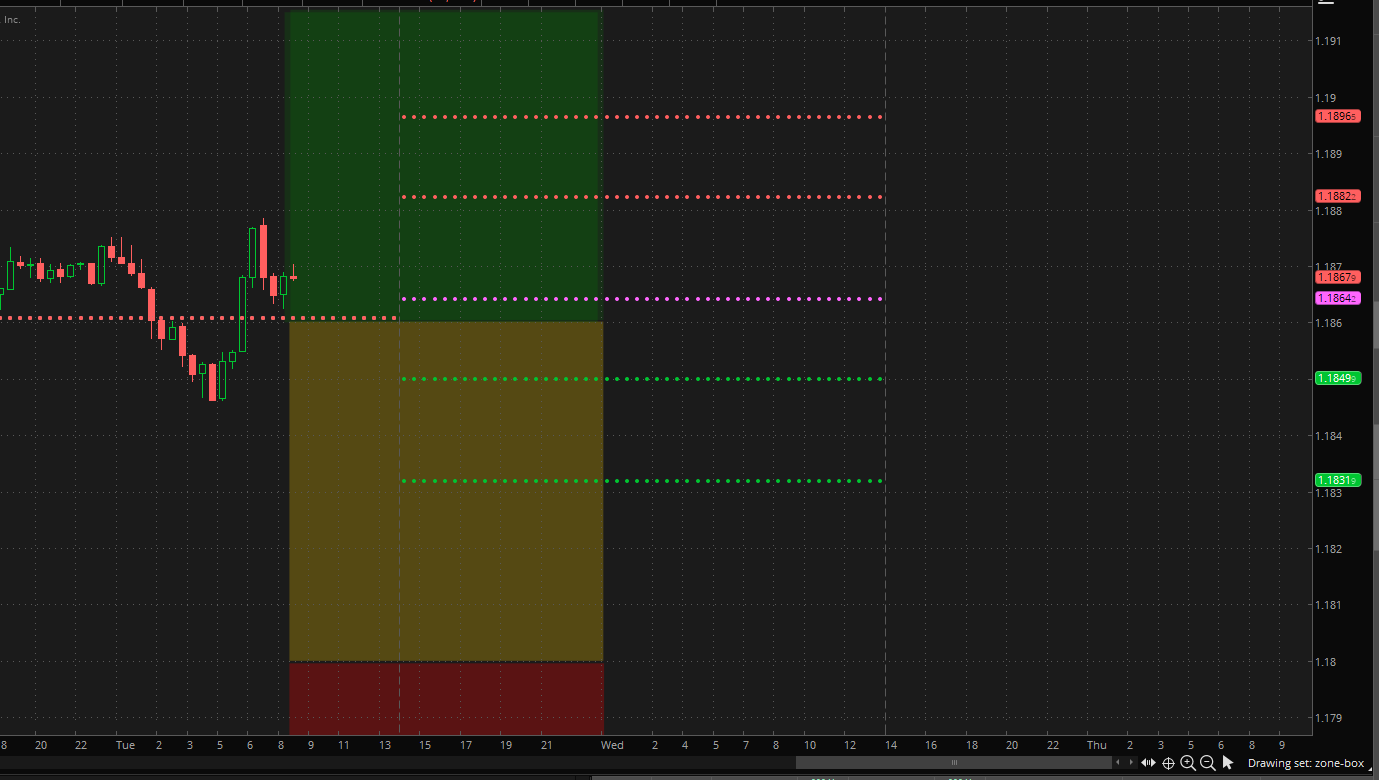
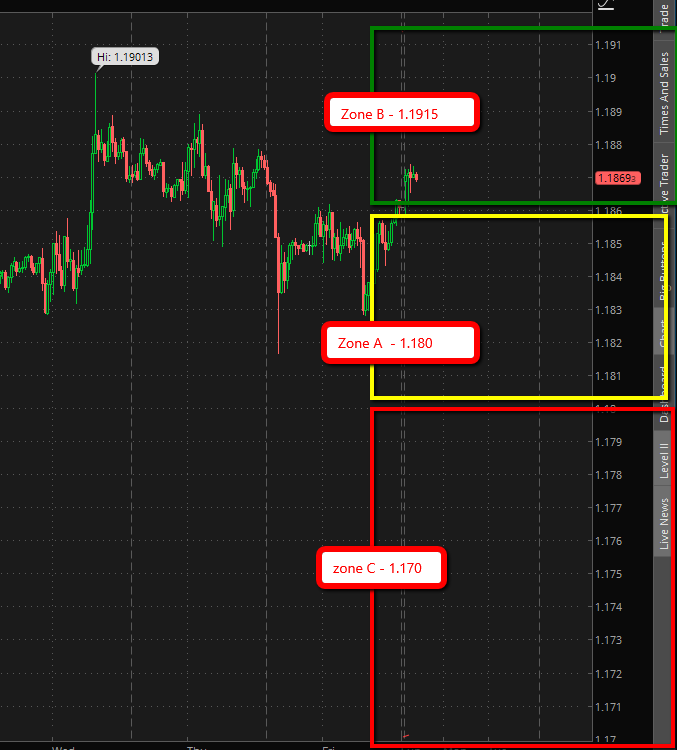
Experimenting with new ‘Zone Trading’ protocols where the target trader sets up trading zones with live orders placed and the trajectory (outcome) is looked at for where the priceline falls within a particular zone. Zone A (yellow) = the current price range Zone B (green) = upper price band marked by a limit order at the top. Zone C (red) = lower price band marked by a limit order at the bottom.
Dec. 28, 2017
6:30PM PST
ANALYSIS/ACTION STEPS
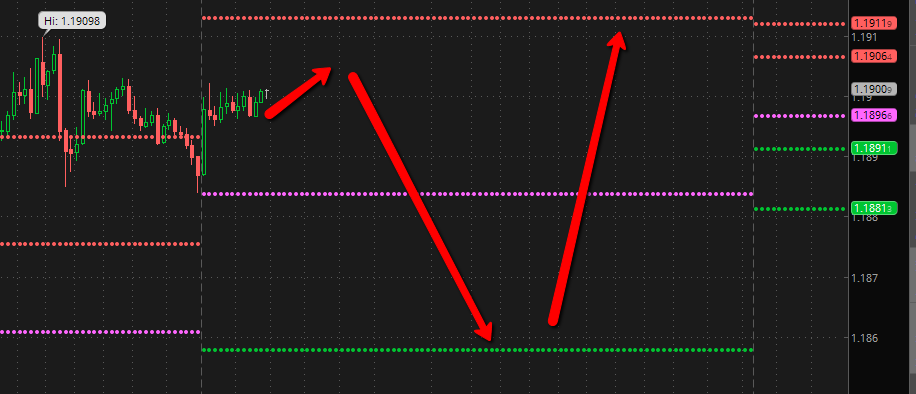
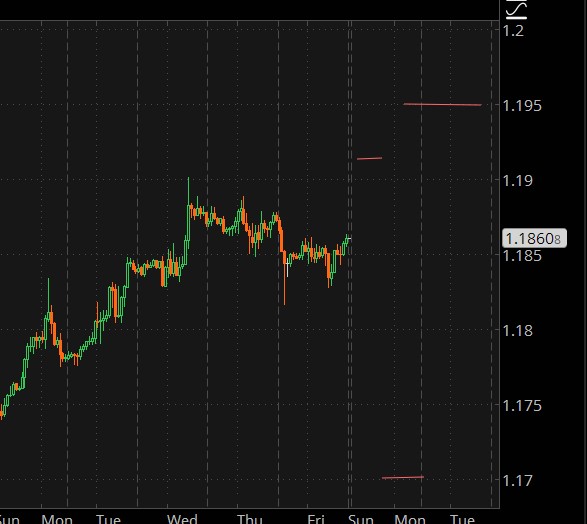
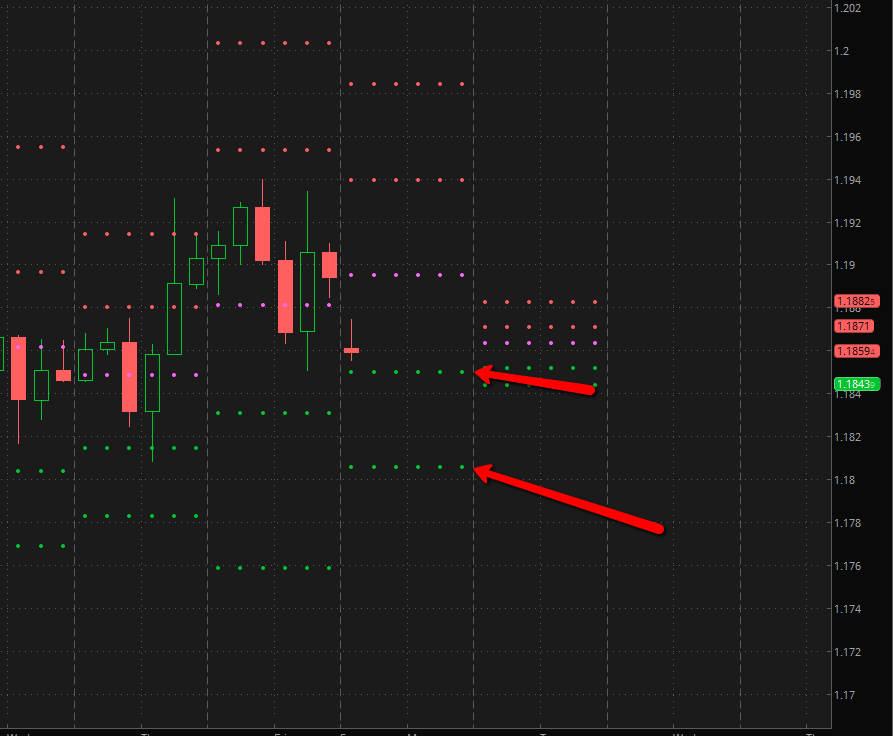
Today’s session work was to test the idea of verifying the trajectory of six new orders placed by the client. This was very difficult because the signal line is weak and each order represents very little in terms of “emotional value” to the target and has little impact on the targets account. We think this is a overall good idea but needs refinement. The conclusion of the data is noted below. The only order that looks like it triggers is in green, though there was data supporting the lower ones, but perhaps not in the current time-frame. Once viewer got data supporting 1.197 as triggering though this was not corroborated. The reason for the mixed data is because these small orders lack conviction and the true target is the client making money from the overall trajectory which is the target. The catalyst on these orders that have little meaning in the mind of the trader and his account balance to matter.
Dec. 27, 2017
4:45PM PST
ANALYSIS/ACTION STEPS
Today’s session work was solely around the idea of triggering the new order at 1.1860 that the trader has pending. The market wants to go up… and this is clearly in the data but needs to drift down first. Traders are in a scalping mode this week and there is data of price manipulation before the new year. There are so few catalysts with low volume and nothing propping it up. WE got data of “up before the fall” and that it does up. Some viewers got that it hit the Trader’s order(s) at 1.1915 (but this may be AFTER the order at 1.1860 is triggered) – then down to take profit before the “Target Trader is happy” No specific data of a time-frame other then it “drifts down – before it resumes its move up”. Because the moves are small we cannot gauge amplitude – though it may go higher
UPDATE 8:30PM PST
Dec. 26, 2017
4:30PM PST
ANALYSIS/ACTION STEPS
Though biased short this week… the retrace long is higher than the data suggests – thus there is less confidence in the directional data over the next 6 hours. We are holding until New York opens.
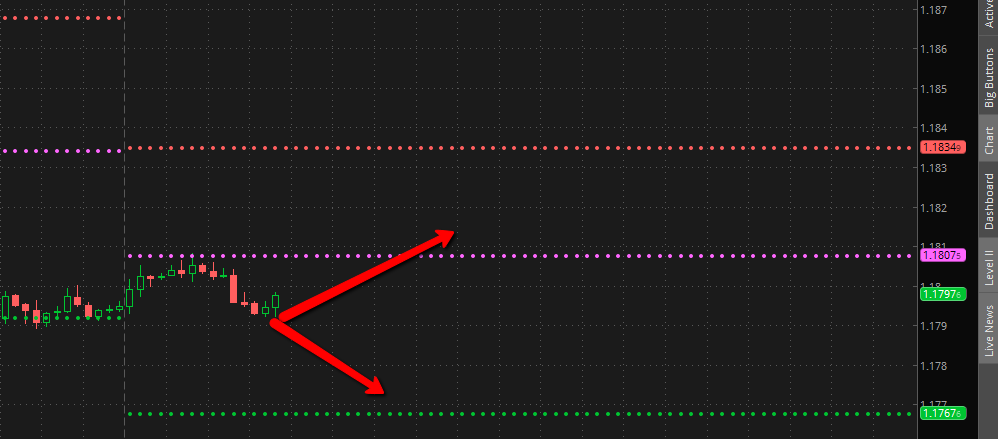
Update: Trajectory continues to drift short into Zone A, with it passing the first pivot line and the potential to retrace. If there is a retrace it is not for any extended period and may drift past the pivot line at 1.183. The moves are not big. Zone B or Zone C are not triggered. The bias is short.
Dec. 26, 2017
8:43AM PST
ANALYSIS/ACTION STEPS
Update: Trajectory followed yesterdays data as per the chart below. Th system is being refined to include the zone and the direction of the daily trajectory from the current pivot line. Trader will be able to trade within the zone and determine whether the price line penetrates a pivot line (support & resistance) This should provide all the data necessary to navigate the trajectory. (the color areas are the Zones as determined by Trader’s actual live orders and the pivot lines are determined by the daily support and resistance levels)note: image can be expanded by clicking on it.
Dec. 25, 2017 4:50PM
ANALYSIS/ACTION STEPS
24 hour trajectory: Outside of Zone B top price of 1.1915 is not triggered. Trend line drops into Zone A. Zone C low (1.170) price bar does not trigger. Zone C (1.180) price does not trigger.
The bias from open of this trajectory is down, after a small move up. This will be sideways in the 1.18 range. There is very little movement over the next 48 hours. Trade bias is down with target trader intention to scalp. No new orders are triggered.
WEEK 3 – DECEMBER 17, 2017
OVERVIEW: Data on the overal trajectory for the week produced signifincantly different results than last week. There is some news item (unidentified at the time of this writing) that acts as a catalyst for positive news on the EUR. This may have something to do with BREXIT as this was an element in the data. We will be probing for the timing of this event and looking for what it means as it relates to price and timing of the move.
DAILY UPDATES
ANALYSIS/ACTION STEPS
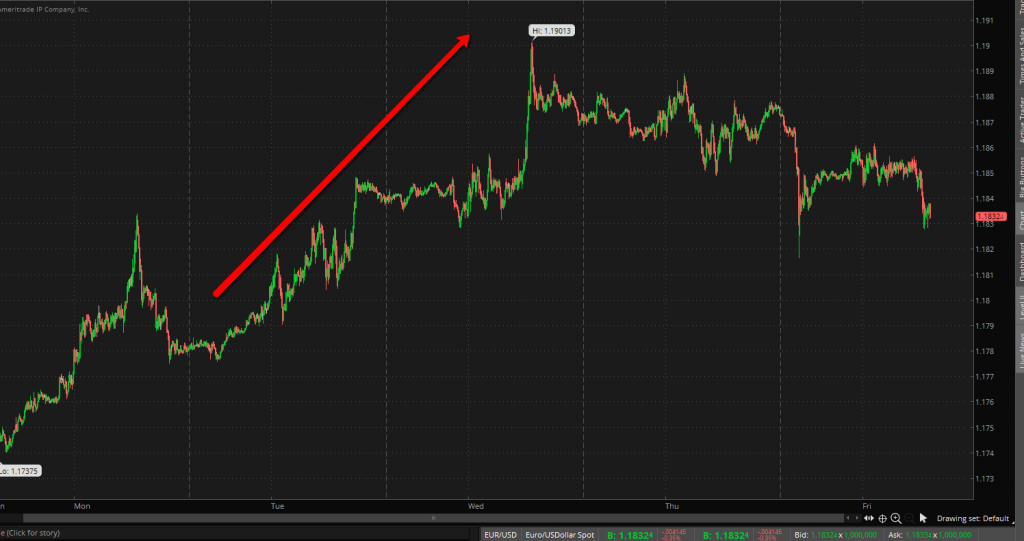
Per the data of a long play this week… the EUR trajectory did exactly that, and gained nearly 150 pips from the start as forecast. A great trading week with the trend dialed in.
Note: The trader will place orders around the pivot lines and TRV will verify the trajectory of the trigger point for BUY and SELL order.
DAILY UPDATES
Key Data Points For : 12/17/2017
“short will continue” “watch the pivot” “news will turnaound quickly” “long on the good news”
ANALYSIS/ACTION STEPS
The idea of the short continuing was prevelant however looking over the 24 hour trajectory the market turns long at some point. There may be postive news on the horizon. One view got the data element of “Brexit” and something favorable to the European Union. This may not be as signfincant of a move as the data suggests, but there is a turn that happens. and the price returns long. We did not get a “buy” price triggering at 1.173 but it looks like 1.1763 does.
Note: The protocols for this price bracketing are awkward and will need refinement – though the idea can assist in pinpointing a directional bias. It could mean that BOTH targets are hit on a BUY the way ts configured because TRV data cannot discern one order cancelling another.
WEEK 2 – DECEMBER 10, 2017
OVERVIEW: The initial data set for trading this week reveals significant volatility unlike last week. There is no certain direction for the first few days though we may see more swings than last week. Looks to be down initially and then an up move before the meeting. We will be tracking this weeks moves carefully with greater focus on 24 hours prior to the meeting.
DAILY UPDATES
Key Data Points For : 12/15/2017
“short contunuation” “lower means lower” “take profit line not hit” “exit trade at next pivot”
Key Data Points For : 12/13/2017
“hold on – no long” “wait to hit lows” “going down” “lower than you think” “its below the next piviot” “conflict – war of the banks” “Not what you think”
Key Data Points For : 12/12/2017
“long move” “breakout level” more-volume more volatility” “long is good” “market returns”
Key Data Points For : 12/11/2017
“short move – before the up spike” “there is low volume – and more high-lows” “hold on long until the market settles” “long on retrace event”
ANALYSIS/ACTION STEPS
UPDATE: Dec 14 2017 (4:30 PM PST): The drop was as forecast in the data from a weak ECB rate position catalyst should continue per the latest TRV updates. The trader short position entry was 1.1860 was verified in the blind as “profitable” and “optimum” but will be “exited prior to the TP line”. Next week we will adjust the movements to accommodate optimum exit strategy.
UPDATE: Dec 14 2017 (3:50 AM PST): Data was run in several sessions to verify a move down post release of the ECB rate meeting Dec 14-2017. Market may bounce initially with not a clear direction and market sentiment that favors EUR – with a tighter monetary policy, but the subsequent remarks (sell on the news) make for a short play. Market seems confused by the “double-speak” initially but once a direction is established the volume piles on. It may be a few hours before it settles for any bounce play.
UPDATE: Dec 13 2017 (9:16 AM PST): The data suggests the drop after the FED meeting is lower than expected. Before any long positions let the low settle in after a few hours. May retrace lower than November levels (below the 1.1680 threshold.. into the next pivot level before it moves up. Confidence is not high on this and data suggests market is confused about the ECB rate meeting a few hours from now. The data of “this is a crossroads” feels like a conflict between the Central Bank in the USA and the Central Bank in Europe. Expect the move to be constantly shifting. (Will update before ECB meeting – outcome)
UPDATE: Dec 13 2017 (5:45 AM PST): This looks like the “head fake” in the data – which means this was a top prior to the fed announcement.
UPDATE: Dec 12 2017 (4:48 PM PST): Market is anticipating a FED rate increase and a stronger USD. Some of this may be priced in now from yesterdays move, and a rise in EUR is a bit of a head fake. The FED WILL increase rates most likely by 25 basis points. The market has priced this in for the most part. The will be forward guidance and the proposed 3 times rate hikes for 2018 may be stated as more aggressive then the original stance made in September 2017 – especially with the new tax cuts which are expected to boost the economy. We will verify this in the early AM and update. The early data suggests the trajectory to fall after a brief up-move.
UPDATE: Dec 11 2017 (4:30 PM PST): Long is the play for the target trader – but not until a retrace which may enter into the support zone in the 1.176 area. Data supports a more extending move past the next resistance line.
UPDATE: Dec 11 2017 (6:30 AM PST): The retrace is the short area and the move up should continue for the next 12+ hours
UPDATE: Dec 10 2017 (2:15 PM PST): The looks short initially before any long move.
WEEK 1 – DECEMBER 4, 2017
OVERVIEW: The initial data set for trading this week revealed since the last ECB meeting in which the target trader was able to recover from a short position – that entry of a long position was optimum – and this is now consolidating and is about to retrace later this week after another day of two of price movement overall following the upward trend. The interest in short positions will increase and it would dangerous to maintain a long position more than 24-48 hours. (We will revisit the trajectory each day prior to London open to look at the prevailing trend and directional bias)
There are scalping opportunities this week, but overall the long trend may not sustainable for more than another 70 pips above Fridays close. We looked to to see if it would reach the top resistance line and it appears not – before a significant retrace event first.
REViSED- TRADE PLAN (For Week beginning Dec 4 2017): Next 2-3 days scalp a few pips long, but it is dangerous to hold ANY long positions now for anything other than a few scalp trades. Best to wait for a retrace or get out in 24 hours after a small run up. Maintain a long bias this week was the key data element but only entering long after a retrace (the price points were not specific though there was data referencing pivot points – which could mean to watch it drop to or near the 1.18 level
A key data point is that this could be a very fragile top that may collapse this week and though the bias is long and any retrace event is another long opportunity… it will be a zig zag pattern of small up and down moves during this consolidation period.
DAILY UPDATES
Key Data Points For : 12/08/2017
“head fake” “thinking ahead of the move” “short lived – not long”
Key Data Points For : 12/07/2017
“not what you think” “surprise move “market confused” “up and down both” “hold”
Key Data Points For : 12/06/2017
“trader is long” “pops up a little” “20-25 pips” “passes the line” “exercise caution”
Key Data Points For : 12/05/2017
“a downward move” “scalp short – better than long” “lacks conviction” “traders holding pattern” not worth trading until a significant move down
Daily – Key Data Points For : 12/04/2017
“24 hours – long” “Reversal of fortune’ “wait for a retrace to enter” “bounces off pivot line” “good call – aim small”
ANALYSIS/ACTION STEPS
UPDATE: Dec 78 2017 (6:30 AMPST): The 12 hour trajectory was short as forecast and fell below the pivot support line with a low of 1.1729 before it bounced up. No further trade opportunity till markets close
UPDATE: Dec 7 2017 (3:30 pmPST): Looking at the next 12 hours… this appears a continuation of the downward pressure – though not significant. We do not see it extend past the support pivot.
UPDATE: Dec 7 2017 (8:58 am PST): No direction, no conviction. No trade opportunity as the data suggested. New update in 8 hours.
UPDATE: Dec 6 2017 (5:42 PM PST): Mixed data on the move… like the market has zero conviction. The idea of an upward continuation was the most prevalent idea but the analysis could support either. The signal would be considered a hold – thru the London open.
UPDATE: Dec 6 2017 (7:30AM PST): The long move popped over the line as forecast but then retraces back to the support level pivot of 1.18 -which may bounce back to the pivot line (purple) or continue short below the 1.18 level. This is all speculation as this is NOT verified. In today’s update we will look specifically to this. Because it crossed the support line, this may change the trajectory.
UPDATE: Dec 5 2017 (4:30PM PST): Long seems to be the overall direction tonight, but its not to be trusted. This would be a scalp trade only
UPDATE: Dec 5 2017 (6am PST): Retraces to pivot line as forecast which could be the beginning of a more robust up move.
UPDATE: Dec 4 2017 (5PM PST): Continues consolidation. No real trade here but expect it to drop first to the next pivot line next before moving long. Possible scalp trade.
These are the pivot lines to trade off for the next day or two, unless it retraces past the 1.18 level